
We use cookies on our website to give you an improved browser experience. View our Privacy Policy for more information. Please make your selection to opt in or out of ALL cookies here: Accept or Decline
A Theme Park Business Model can turn a single admission into a full day of spending. Guests buy tickets, then encounter restaurants, merchandise shops, games, and sometimes hotels. Each offering gives the park another way to earn revenue from the same visit. The strongest parks sell more than rides. They sell a carefully staged day, from the first gate scan to the evening show.
Walt Disney, the creator of Disneyland and a defining figure in the theme park industry, once said, “Disneyland is a work of love. We didn’t go into Disneyland just with the idea of making money.” That perspective points to a useful tension: emotional experiences can support commercial success, but they take serious planning and investment. Parks must maintain rides, train staff, manage crowds, and keep guests comfortable in heat or rain. A bright parade may look effortless. Behind it are schedules, safety checks, and substantial operating costs.
Repeat visits can strengthen the model. Seasonal events, annual passes, new attractions, and familiar characters give guests reasons to return. Hotels and dining can extend a short visit into a longer stay. But none of this guarantees profit. Construction costs are high, demand shifts with the economy, and a poorly managed queue can sour an expensive day. That matters. The business is compelling, not automatic. Understanding its revenue streams, costs, and risks reveals why a well-run park can be so profitable—and why even a beloved destination must keep earning its next visit.
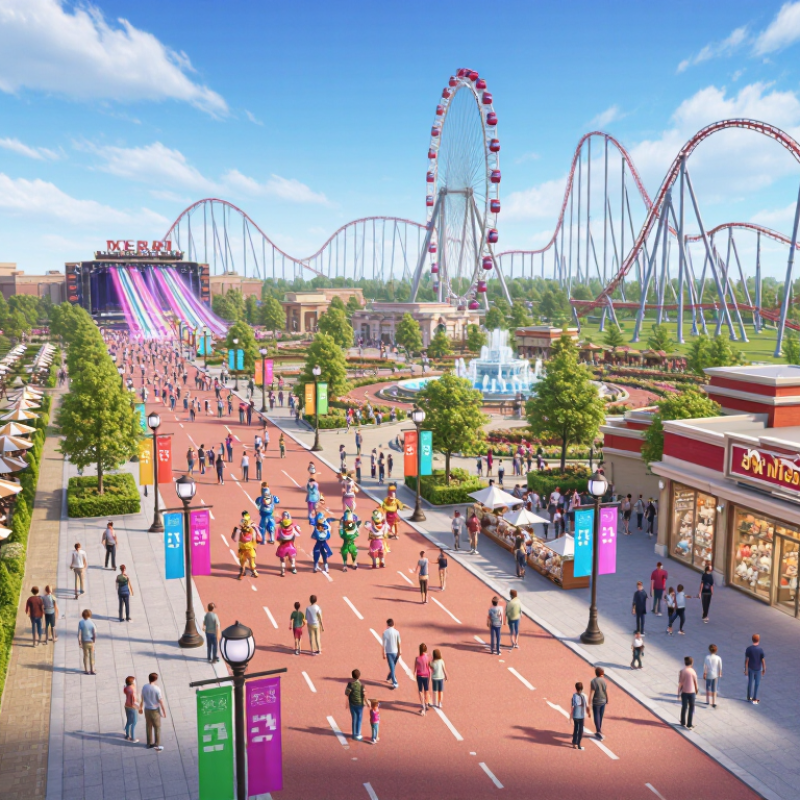
A theme park is not simply a collection of rides; it choreographs a full day. A shaded queue, distant music, themed signs, and the smell of fresh food can make waiting feel like part of the story. That matters because visitors pay for more than ride time. They enter a setting where walking, eating, and taking photos feel connected. The effect is practical: guests may stay longer, visit more attractions, and spend on meals or souvenirs. Details matter. If a carefully designed street ends beside a noisy service area, the illusion can weaken.
Distinctive entertainment combines narrative, physical space, and live operations. A ride can introduce a story; performers, lighting, and seasonal events can carry it beyond the vehicle. Staff training is part of the product, too. A helpful answer or calm response can protect a guest’s experience. Designers must also consider capacity, accessibility, maintenance, and weather—not just visual drama. A beautiful attraction that creates a two-hour bottleneck may frustrate more than delight. There is no perfect formula. Some guests want intense rides; others prefer quiet gardens, clear paths, or a place to sit. Parks build loyalty by offering different ways to participate while keeping the imagined world believable. Sometimes, though, a small operational flaw is what visitors remember.
A theme park earns money from more than the gate. Admission provides a large, visible share, while ticket prices can vary by day and season. A quiet weekday may cost less than a crowded summer Saturday. That pricing helps match demand, though it can make planning feel less simple for families.
Inside the park, food, drinks, and merchandise add steady revenue. A cold drink near a sunny queue or a quick meal between rides solves an immediate need. Small purchases matter. Per-guest spending often depends on convenience, location, and wait times, not just product choice. Operators also earn from parking, photo packages, and paid experiences. These extras can lift spending, but poorly timed offers may frustrate guests.
Hotels, special events, and seasonal passes create income beyond single-day visits. A nearby hotel can encourage guests to stay longer, while evening events use park space after regular hours. Passes bring repeat visits and earlier cash flow, but frequent visitors may spend less on each trip. That trade-off is easy to underestimate. Rain, maintenance closures, and staffing costs can also weaken expected returns. A queue may look profitable from a distance, yet every extra minute can reduce guest satisfaction and future visits.
Theme parks earn more by shaping when and how visitors spend, not only by selling admission. A dated ticket can cost less on a quiet weekday and more during school holidays. This helps parks spread crowds and match prices to demand. Yet a family may find the calendar confusing, especially when prices change across several dates.
Spending continues inside the gates. A meal near a ride, a shaded drink stand, or a locker beside a water attraction can feel worth the extra cost. Photo packages and shorter queues also sell convenience to guests with limited time. Small choices add up. A park can improve these offers by showing prices clearly before checkout and placing essentials where visitors need them. Bundles may help, but only when guests can see what each item costs on its own.
There is a limit to this strategy. If every useful service feels like an add-on, visitors may feel charged at each turn. That matters. Long waits, unclear fees, and crowded dining areas can make extra spending feel less like a choice. Parks need to weigh short-term sales against guest trust, while accounting for staffing, maintenance, and seasonal demand. The balance is imperfect, and a cheaper ticket does not always mean a cheaper day.
A theme park earns from controlled capacity: a single site can welcome many guests during the same operating day. Rides, paths, and theaters are used again and again, so the cost of serving one more visitor may be lower than the cost of opening the park at all. But capacity is not simply a matter of selling more tickets. Queues, meal periods, and ride downtime can turn a crowded day into a poor guest experience.
Many expenses remain even when attendance is low. The park still needs trained staff, inspections, landscaping, utilities, and working equipment. These fixed costs make each operating day expensive, yet they can be spread across more admissions when attendance rises. Full parking lots help. They also bring pressure: crowded walkways and long waits can erode the value guests feel they received.
Scale can improve purchasing, maintenance planning, and staffing across a large operation. For example, a central repair team may coordinate parts and schedules for several rides, while food outlets share storage and deliveries. Still, scale does not guarantee efficiency. A delayed repair can affect several schedules at once, and forecasts are imperfect. The arithmetic can look cleaner than the day itself: rain, uneven arrival times, or a popular ride closing can leave capacity unused while costs keep running.
Repeat visits help explain why theme parks can earn steadily after their major rides and infrastructure are built. A returning guest already knows the layout, may bring family or friends, and can spend on meals, games, or merchandise during another visit. Seasonal events and new attractions give familiar places a fresh reason to return. Small details count.
The 2023 TEA Global Experience Index, prepared with AECOM, reported 244.6 million visits across the world’s 25 most-visited theme parks, up 23.1% from 2022. That figure measures visits, not unique guests or repeat rates. That distinction matters. Still, high visit volumes create opportunities to spread operating costs across more guest-days and build loyalty through consistent service. Season passes can encourage more frequent trips, while targeted upgrades may keep longtime guests interested. But the logic is not automatic: discounts can reduce revenue from guests who would have visited anyway, and crowded weekends can weaken the experience. Operators must balance access, capacity, and spending carefully. Even loyal visitors can drift away.
An operating scorecard showing how repeat visits and loyalty can support long-term profitability. Metrics are defined for analysis; no company-specific figures or industry-wide benchmarks are implied.
| Business Dimension | Metric and Definition | How It Supports Profitability | What to Monitor |
|---|---|---|---|
| Repeat visitation | Repeat-visit rate = visitors who have visited before ÷ total visitors in the period. | Returning guests can provide demand without relying entirely on first-time visitor acquisition. Their value depends on visit frequency, spending, and the cost of encouraging another visit. | Repeat-visit rate by season, guest segment, and time since the previous visit. |
| Visit frequency | Average visits per guest = total visits ÷ unique guests over a defined period. | More visits from existing guests can increase lifetime revenue and help stabilize attendance across the operating year. | Average annual visits, weekday versus weekend visits, and attendance between major holidays. |
| Guest loyalty | Membership renewal rate = renewing members ÷ members eligible to renew. | Renewals can make future demand more predictable. Membership profitability depends on benefits used, visit patterns, and the cost of serving members. | Renewals, member visits, benefit usage, and revenue per member after service costs. |
| Admission revenue | Admission revenue per visit = admission revenue ÷ total visits. | Admissions provide the core paid-entry revenue stream. Pricing and ticket mix affect revenue, while attendance capacity and guest experience constrain how far prices can rise. | Revenue per visit by ticket type, advance-purchase share, and attendance relative to capacity. |
| In-park spending | Per-capita in-park spending = eligible food, merchandise, and other in-park revenue ÷ total visits. | Food, merchandise, and paid experiences can add revenue beyond admission. Their contribution depends on product margins and the incremental costs of delivery. | Spending per visit, transaction rates, average transaction value, and category-level gross margin. |
| Capacity utilization | Attendance-to-capacity ratio = attendance ÷ practical operating capacity for the same period. | When attendance increases within available capacity, fixed operating costs may be spread across more visits. Congestion, staffing needs, and maintenance requirements can limit the benefit. | Attendance by day, ride or attraction availability, queue times, and variable cost per visit. |
| Seasonality | Off-peak attendance share = visits during defined off-peak periods ÷ total annual visits. | Events, promotions, and repeat-visit offers can help use facilities outside peak periods. Their value depends on incremental attendance and the cost of the offer. | Off-peak visits, offer redemption, incremental spending, and operating cost per open day. |
| Guest acquisition | Guest acquisition cost = eligible marketing and sales costs ÷ new guests acquired. | Strong word of mouth and repeat demand may reduce dependence on paid acquisition, but marketing efficiency should be evaluated against the revenue and margin generated. | Acquisition cost by channel, first-visit conversion, repeat rate of acquired guests, and guest lifetime value. |
| Long-term investment | Return on investment for an attraction or upgrade = incremental operating profit ÷ invested capital, measured over a defined period. | New attractions and refreshed experiences can encourage return visits and support pricing. Returns are not guaranteed and depend on investment cost, attendance, operating expense, and asset life. | Capital cost, incremental visits, incremental spending, maintenance expense, and payback period. |
We use cookies on our website to give you an improved browser experience. View our Privacy Policy for more information. Please make your selection to opt in or out of ALL cookies here: Accept or Decline
Do you consent to the use of ALL cookies?
901 2nd Court West
Birmingham, AL 35204
Sales: 866.481.4036
Logistics/Ops: 866.481.4036
2101 Dralle Road
University Park, IL 60466
Sales: 708.813.9070
Logistics/Ops: 708.235.4200
400 E. 13th Street
Little Rock, AR 72114
Sales: 866.760.5344
Logistics/Ops: 866.760.5344
225 Collins Road
Elkhart, IN 46515
Sales: 574.295.0214
Logistics/Ops: 574.607.4611
601 Berryman Pike
Tipton, IN 46072
Sales: 800.897.7591
Logistics/Ops: 800.897.7591
3900 Uvalda Street
Denver, CO 80239
Sales: 303.706.8000
Ops/Logistics: 303.576.8398
510 3rd Street E
Milan, IL 61264
Sales: 800.322.1052
Logistics/Ops: 800.322.1052
1660 E. Aurora
Des Moines, IA 50313
Sales: 800.671.1660
Logistics: 800.671.1660
86554 Gene Lasserre Blvd.
Yulee, FL 32097
Sales: 904.253.3060
Logistics/Ops: 904.225.3000
694 S.E. County Road 245
Lake City, FL 32025
Sales: 800.727.6706
Logistics/Ops: 386.752.7412
210 Neptune Road
Auburndale, FL 33823
Sales: 863.967.1131
Logistics/Ops: 863.777.9814
4601 McCoy Drive
Pensacola, FL 32503
Sales: 850.308.7030
Logistics/Ops: 850.434.5502
815 South 56th Street
Tampa, FL 33619
Sales: 813.302.1940
Logistics/Ops: 813.621.1352
200 Hosea Road
Lawrenceville, GA 30046
Sales: 770.953.7575
Logistics/Ops: 770.513.6000
Branch Product Guide
Branch Line Card
Moulding Offering
Cedar Offering
Column Offering
8173 Hwy. 165 North
Monroe, LA 71211
Sales: 800.256.4165
Logistics/Ops: 800.256.4165
508 Warren Avenue
Portland, ME 04103
Sales: 207.888.2331
Logistics/Ops: 207.797.6565
4300 Georgia Pacific Blvd.
Frederick, MD 21704
Sales: 301.798.7474
Logistics/Ops: 301.874.8000
419 Maple Street
Bellingham, MA 02019
Sales: 508.449.0535
Logistics/Ops: 508.966.5500
825 Buchanan Ave SW
Grand Rapids, MI 49507
Sales: 877.800.1180
Logistics/Ops: 616.278.0909
995 Pacific St. NW
Aitkin, MN 56431
Sales: 800.432.3727
Logistics/Ops: 218.212.7770
1102 Port Terminal Drive
Duluth, MN 55802
Sales: 800.951.9899
Logistics/Ops: 800.851.9899
9110 83rd Ave. North
Brooklyn Park, MN 55445
Sales: 763.425.0204
Logistics/Ops: 763.425.0204
910 E. Railroad Street
Long Beach, MS 39560
Sales: 866.535.4135
Logistics/Ops: 228.205.2400
1727 Warren Street
North Kansas City, MO 64116
Sales: 800.621.2611
Logistics/Ops: 800.621.2611
2123 North Golden
Springfield, MO 65803
Sales: 800.375.7891
Logistics/Ops: 800.375.7891
13860 Corp. Woods Trail
Bridgeton, MO 63044
Sales: 314.209.0800
Logistics/Ops: 314.209.0800
1109 South 19th Street
Omaha, NE 68108
Sales: 800.489.6637
Logistics/Ops: 800.489.6637
1 Luger Road
Denville, NJ 07834
Sales: 973-339-3539
Logistics/Ops: 973.625.1461
3720 Jeffrey Blvd.
Blasdell, NY 14219
Sales: 716.235.5989
Logistics/Ops: 716.825.6557
319 Yaphank Ave.
Yaphank, NY 11980
Sales: 631.358.5714
Logistics/Ops: 631.924.7401
3300 Parkside Drive
Charlotte, NC 28208
Sales: 800.839.2588
Logistics/Ops: 704.394.3172
1712 East D Street
Butner, NC 27509
Sales: 984.389.8200
Logistics/Ops: 919.575.3700
128 Foothills Drive
Statesville, NC 28687
Sales: 800.222.1414
Logistics/Ops: 704.394.3172
550 Munroe Falls Rd.
Tallmadge, OH 44278
Sales: 330.357.4506
Logistics/Ops: 330.794.1141
10347 Toebben Dr.
Independence, KY 41051
Sales: 859.298.3926
Logistics/Ops: 859.746.2250
450 N. MacArthur
Oklahoma City, OK 73127
Sales: 800.375.6025
Logistics/Ops: 800.375.6025
1680 North Aspen
Broken Arrow, OK 74012
Sales: 918.272.2212
Logistics/Ops: 918.272.2212
522 Bridge Street
Hunker, PA 15639
Sales: 878.217.2001
Logistics/Ops: 724.925.7285
4290 Atlanta Street
Charleston, SC 29418
Sales: 843.371.1420
Logistics/Ops: 843.554.8192
1040 S. Industrial Dr.
Erwin, TN 37650
Sales: 423.641.1005
Logistics/Ops: 423.742.5911
4287 Pilot Drive
Memphis, TN 38118
Sales: 901.365.2101
Logistics/Ops: 901.365.2101
700 Myatt Drive
Madison, TN 37115
Sales: 615.327.9547
Logistics/Ops: 629.777.4949
4747 Mark IV Parkway
Fort Worth, TX 76106
Sales: 866.323.5117
Logistics/Ops: 817.625.9091
6990 Market Avenue
El Paso, TX 79915
Sales: 915.778.6356
Logistics/Ops: 915.265.7200
2502 Wilson Road
Harlingen, TX 78552
Sales: 800.580.6711
Logistics/Ops: 800.580.6711
10,000 North Loop East
Houston, TX 77029
Sales: 713.921.1977
Logistics/Ops: 713.675.3544
702 East 44th St.
Lubbock, TX 79404
Sales: 866.454.6010
Logistics/Ops: 866.454.6010
535 N. WW White Road
San Antonio, TX 78219
Sales: 800.284.0488
Logistics/Ops: 210.333.8112
142 Pine Haven Shores Rd.
Shelburne, VT 05482
Sales: 802.800.2540
Logistics/Ops: 802.985.2512
4700 Bethlehem Road,
Richmond, VA 23230
Sales: 804.201.2400
Logistics/Ops: 804.342.1161
4516 N Barker Road
Spokane Valley, WA 99027
Phone: 509.892.9420
Toll free: 800.728.6157
8365 N. 76th Street
Milwaukee, WI 53223
Sales: 800.356.9245
Logistics/Ops: 800.356.9245
312 S. Chester Street
Sparta, WI 54656
Sales: 800.362.5864
Logistics/Ops: 800.362.5864
899 Grossman Drive
Schofield, WI 54476
Sales: 800.472.0017
Logistics/Ops: 800.472.0017
